
Rufen Sie uns einfach an, und wir beraten Sie gerne zu unserem Seminar- und Studienangebot.
Unsere Ansprechpartner:

Michael Rabbat, Dipl.-Kfm.
MBA Chief Operating Officer

Claudia Hardmeier
Kunden-Center
Studienbetreuung
Institute und Kompetenzzentren

Bindeglied zu einer Vielzahl an
Unternehmen und Organisationen


2.6.3 Remaining uncertainty and sensitivity to key variables
The input data for capital budgeting are all estimates and forecast of future values. The more far in the future, the more uncertain is the value and the greater the differences in different forecasts.
Some data can be estimated quite accurate with a reasonable effort (e.g. the total investment cost) but this is mostly owed to the relative near time horizon.
Difficult to forecast are long term market developments and product prices, especially when the first product is still some years ahead of today. This is a common problem in budgeting industrial projects because the investment phase, including the construction of the production facilities, usually requires years (e.g. the investment phase of an ammonia plant takes three to four years).
To evaluate the projects economic stability under the identified uncertainties the project economic evaluation is calculated under different scenarios that consider also pessimistic developments of single parameters.
For the parameters with the highest impact on the projects results different scenarios of the future development are drawn and used as input for the capital budgeting. The base case calculation considers all scenarios with the highest probability where as the worst case calculation considers only the most unfavourable scenarios for the different parameters.
Usually, the parameters with the highest impact and the greatest uncertainty on the project’s economic result are product price, feedstock price, cost of capital, plant availability and expenditure for project realization (height of of investment).
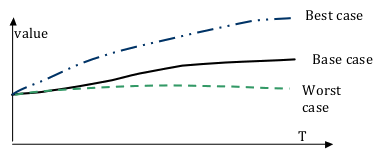
Illustration 3: Trends for scenario analysis
The results help to judge the robustness of the project against changes in the parameters influencing the projects returns16.
The sensitivity of the project’s economic results for the change of important parameters can be displayed graphically.
change of different parameters" class="wp-image-11359 size-full" height="178" src="https://sgbs.ch/wp-content/uploads/Illustration-4-Exemplary-sensitivity-of-the-rate-of-return-for-change-of-different-parameters.png" width="420"> Illustration 4: Exemplary sensitivity of the rate of return for change of different parameters
Ths example shows a high sensitivity of the rate of return to the price of feedstock and product, but a relatively low sensitivity to the cost of completion. This is the case when relatively cheap capital is available to the project.
16 Cf Volckart, page204, 298